


How To Measure And Improve Your Server less Application’s “Health” With Dashbird
Technology and their implementation methodology evolves with time very rapidly. Cost Efficiency and productivity are the key drivers of technological evolution these days. With advent of cloud, infrastructure costs are brought down significantly. And serverless technology adds icing to this. It makes little sense to pay for servers you’re not using most of the time, Serverless or in other words “pay-as-you-go” computing.
AWS Lambda and Serverless computing have become synonymous to each other. However, there are some “Trade-offs” you have to deal with
⦁ Flexibility: Serverless comes with exchange for flexibility, which means you cannot log in to compute instances, or customize the operating system or language runtime.
⦁ Performance: Serverless implementation have higher latency compare to dedicated server architecture
⦁ Diagnosing/Debugging: Diagnosing performance or excessive resource usage problems with serverless code may be more difficult than with traditional server code
dashbird.io helps deal with above Trade offs, it enables users to monitor AWS Lambda functions. Dashbird analyses CloudWatch and gives a very handy and informative tool which enables users to analyze the lambda function health effectively.
Here are some of the ways you can monitor and improve health of AWS Lambda functions through Dashbird.
⦁ Summary View on Dashboard
⦁ Monitoring Individual Lambda Functions
⦁ Logs Analysis
⦁ Project View (for monitoring group of tasks)
Summary View on Dashboard:
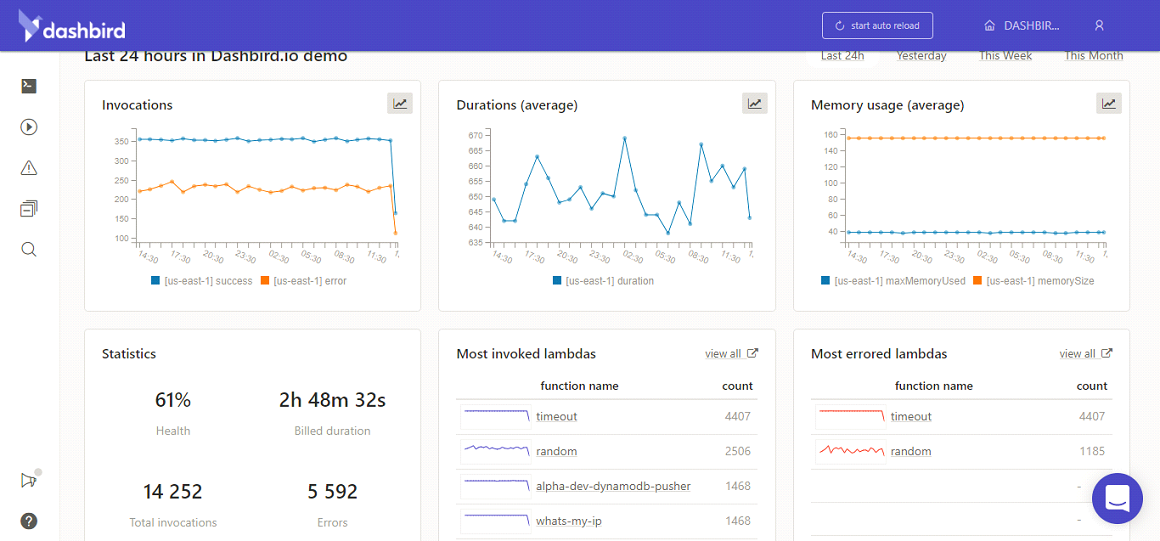
Straight up, dashbird’s dashboard gives you a smart graphical view of successful and erroneous invocations. Also, these invocations are aggregation of all the lambda functions. Comparison of successful vs erroneous invocations gives you a broad view of all functions running.
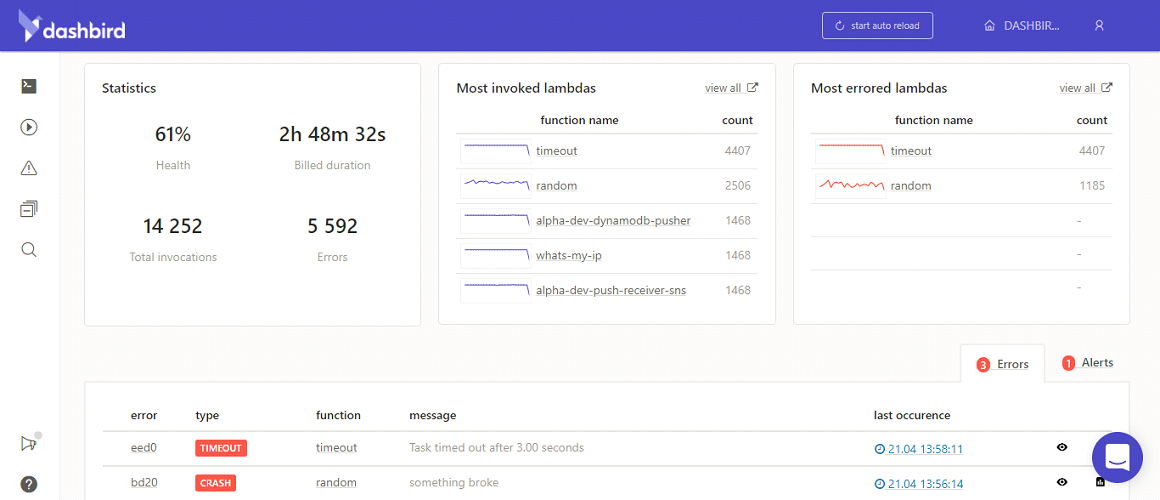
The below picture shows how dashbird also enables you to analyse the summary of all the functions running. The count under “Most errored lambdas” lets you focus on respective lambda functions and the statistics gives you overall picture (viz. Health, Billed Duration, Total Invocation, Errors (erroneous runs))
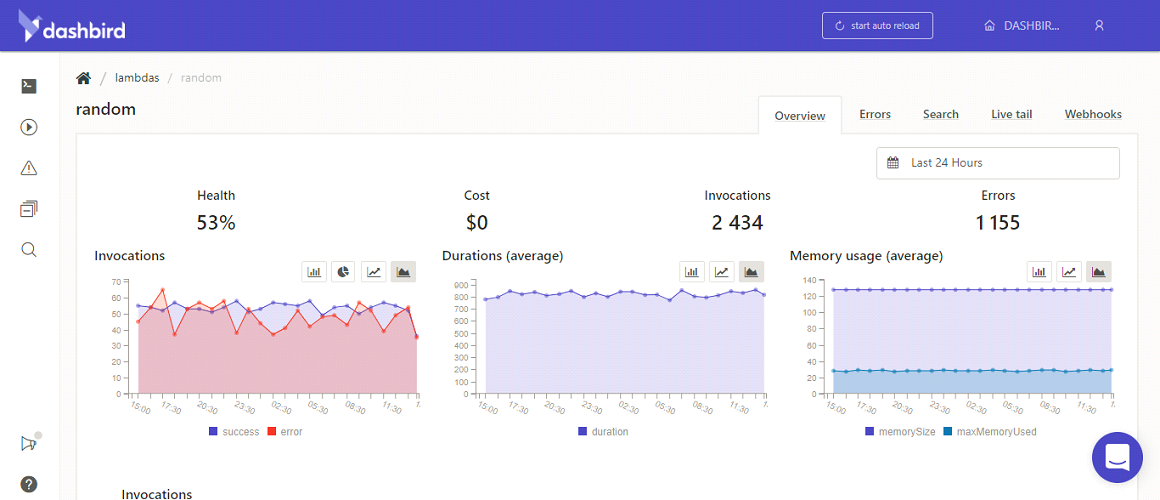
Monitoring Individual Lambda Functions: View on Dashboard:
Following screen shot shows how dashbird enables users to monitor individual lambda funtions. Each row in below screen shot corresponds to a lambda function.
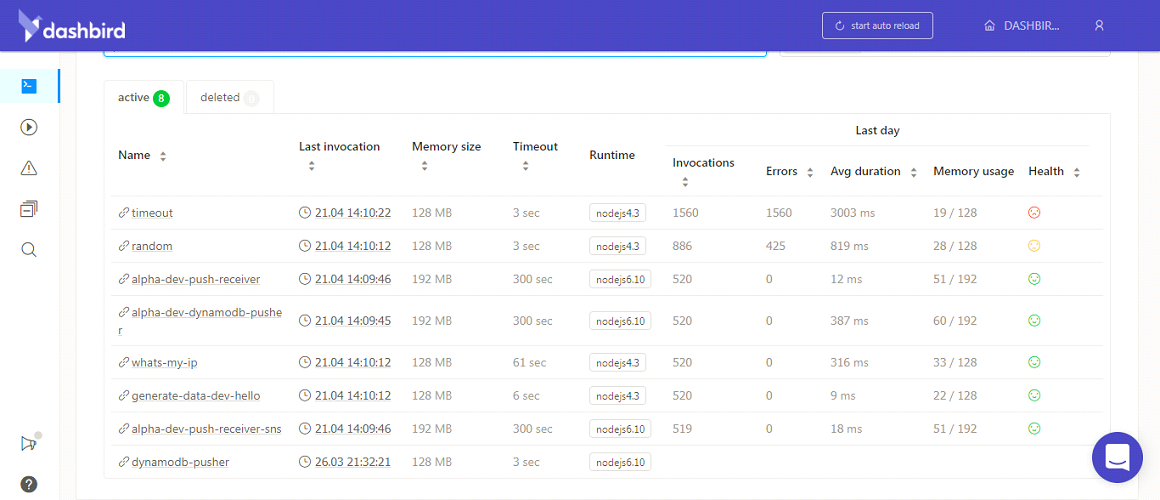
User can get in to one of these rows to have a detailed view. For example, here is the screenshot of lambda function “random”
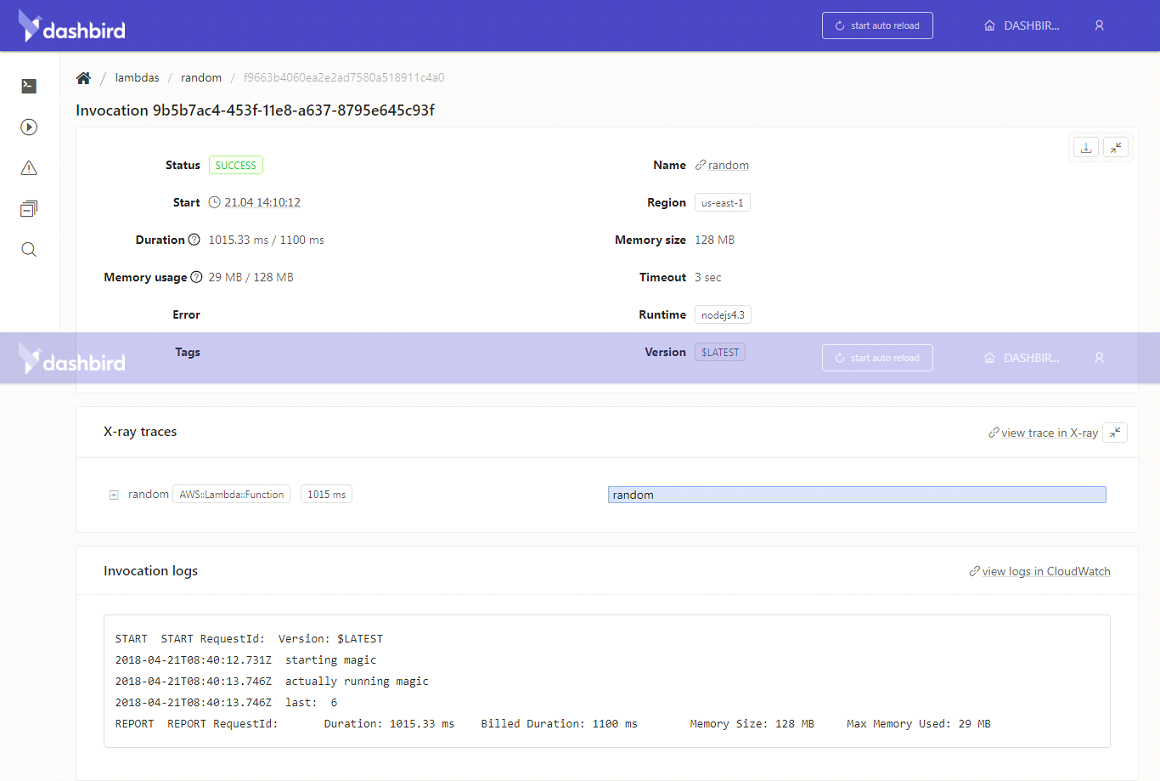
Logs Analysis: dashbird also provide following view where users can analyze specific invocation and assess the logs. There is also a CloudWatch link which takes you directly to CloudWatch for this invocation
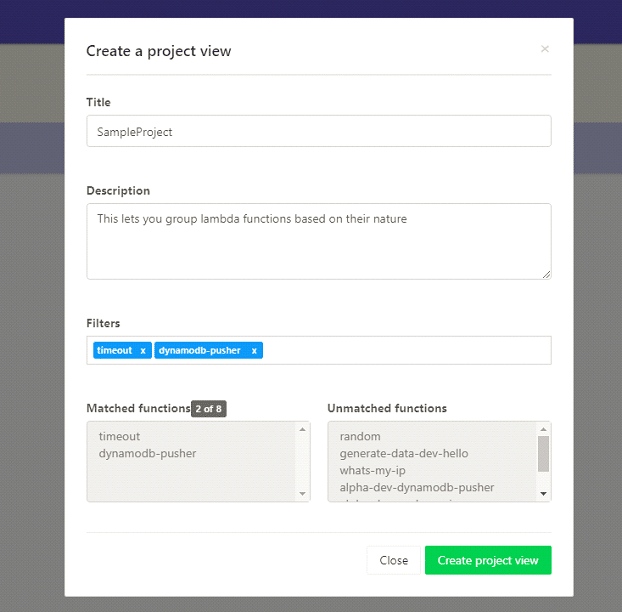
⦁ Project View: This view lets you group subset of lambda functions. Users can group lambda functions based on their needs. For ex, you may wish to group functions based on clients or may be based on applications.